Wildfire maps in the hands of landowners could be a management tool
Writer: Kay Ledbetter, 806-677-5608, [email protected]
Contact: Dr. Diana Doan-Crider, 830-324-6550, [email protected]
Ed Rhodes, 254-774-6060, [email protected]
COLLEGE STATION – When the wildfires are put out and the char washed away, green may start appearing in some areas, but it’s not always easy to tell what is going on with the land and what management practices are needed to help it heal completely.

A team of Texas A&M AgriLife Research and Texas A&M University ecosystem science and management department faculty is working to determine if the maps created of large wildfires by the U.S. Forest Service can be utilized to make those management decisions.
The project was a result of the large West Texas fires and northern Mexico fires in 2011, said Dr. Diana Doan-Crider, an adjunct professor with the ecosystem science department and lead investigator for the project.
“For both areas, it was unique in that private landowners had been impacted at such a large scale,” Doan-Crider said. “The maps are ideal for rapidly assessing very large landscapes after wildfire. They help to target areas that may need attention for erosion control, or monitoring for recovery.”
She said these maps automatically created by the U.S. Forest Service had not been used before as an outreach tool to help private landowners but are readily available to agencies such as the U.S. Department of Agriculture’s Natural Resources Conservation Service.

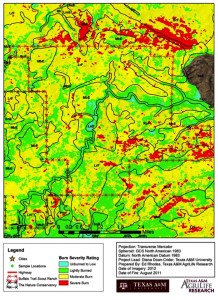
The burn severity maps categorize burned areas – soils and vegetation – into four levels: high, moderate, low and unburned. They can be used to rapidly assess fire impacts across large, inaccessible landscapes, and also to support assessment of immediate impacts to soils or short-to long-term impacts to vegetation.
“We believe these burn severity maps could be effective in helping landowners and land managers gain immediate understanding of the ecological impacts of wildfire despite visual impressions produced by blackened landscapes,” Doan-Crider said.
In 2012, Texas A&M hosted the first workshop for burn severity mapping in Texas, in partnership with the U.S. Forest Service, National Park Service, U.S. Geological Survey and the Texas A&M Forest Service.
Soon after, Doan-Crider, along with Dr. Jay Angerer, an AgriLife Research assistant professor in Temple, and Ed Rhodes, an AgriLife Research senior research associate with the Center for Natural Resources Information Technology at Temple, began the study funded by The Nature Conservancy and AgriLife Research.

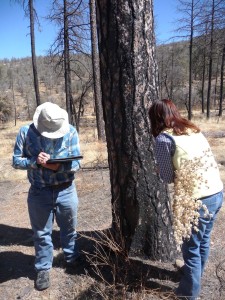
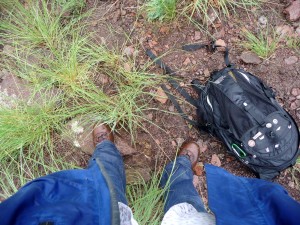
Rhodes said they began doing fieldwork in 2013, ground-truthing what the satellite images were showing on the map. Digital maps were provided for the perimeter of the Davis Mountains Preserve for four fires: Rockhouse and Tejano Canyon, 2011, and Livermore Ranch and Spring Mountain, 2012. LANDSAT satellite imagery allowed them to look at the before and after imagery to determine the change of reflectance on the land.
“It’s useful when 250,000 acres burn in the mountains to help someone determine where to begin spending money to repair the land,” he said. “If you have data on slope and soil type, you can identify potential erosion areas, or you can determine accessibility to roads to know where you can get in the necessary equipment.”
He said after several spots were examined, a statistical analysis was done. Most of the maps they compared were in the 80 percent or better range in accuracy.
For this particular region, Rhodes said, the land was covered with oak and juniper mixed with grassland, so the work they did provided a regional calibration for that region.

By calibrating the satellite reflectance with the on-the-ground conditions, they are able to validate the burn severity classifications from the various landscapes in the region, he said. Going forward, it would be good to map pure grassland and other types of areas, such as a mesquite/cedar mix, to calibrate for them and future fires.
“Landowners could use this as a learning tool and be able to quantify damage done and the expected healing process,” Rhodes said. “They can train themselves on the outcomes to expect and possible reasons. Did it kill the native plants and leave the land open to encroaching weeds? Will there be wind and water erosion because of less plant cover and litter?”
Doan-Crider said after working with landowners, “we realized that the maps provided understanding to them about the overall impacts. The maps identify different levels of impact with different color schemes, compared to just looking at a blackened landscape, which is what most people see after the fires.”
She said when she showed these maps to one landowner, he told her he felt like he was someone who had received bad news from the doctor, but the maps were like a X-ray with which he could develop a “plan of attack.”

“That was key to making me realize the potential of these maps as an outreach tool to landowners,” Doan-Crider said.
Since then, the team is working with the U.S. Department of Agriculture–Natural Resources Conservation Service to get them to host the maps for landowners, and provide them as a tool immediately after wildfires.
“We are in the process of getting this accepted at the national level and hopefully training will take place during 2016,” she said. “We plan to work with the NRCS to set up monitoring studies that will help build models to predict recovery rates for vegetation, which will be important for landowners. We can assume that areas with higher burn severity levels will take longer to recover.”
This can be critical for landowners who do not have a way to know the actual extent and degree of wildfire impacts on their livelihoods, such as reduction of grazing and thus, cattle production. They also may aid in the identification of replacement fencing boundaries, possibly allowing for the temporary exclusion of cattle from moderate to high severity burned areas.
The team ultimately concluded that with the development of ecological and economic models, burn severity categories could potentially be used to allocate disaster funding based on the fact that fire impacts will vary among different areas, and require different recovery periods.
“Burn severity maps can be used to categorize impacts of fire on soils and vegetation over large and rugged landscapes using remote sensing techniques,” Doan-Crider said. “These maps can be made available at a relatively low cost to help determine the best monitoring and recovery approaches.”


