New animated map illustrates annual change in vegetation
Texas A&M Natural Resources Institute visual provides agricultural, other insights using satellite imagery

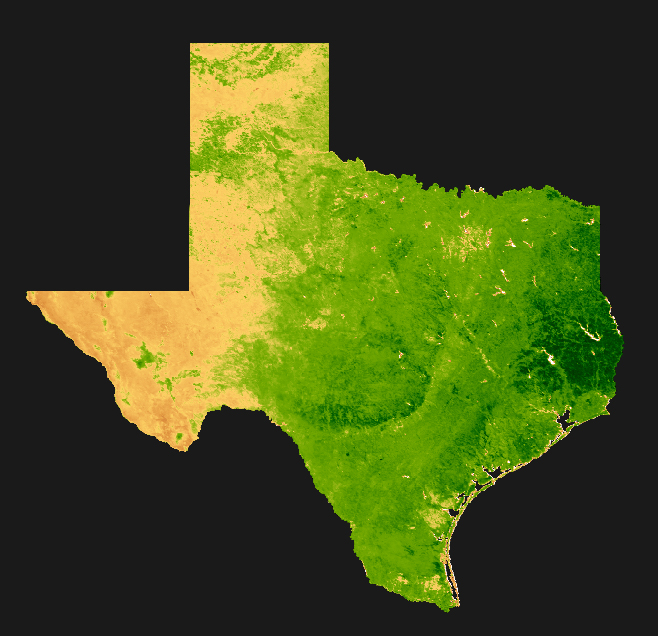
In its most recently featured map, the Texas A&M Natural Resources Institute, NRI, has taken satellite imagery collected throughout 2019 and brought it together in an animated way to illustrate changes in vegetation across Texas throughout the year.
NRI operates as a unit of the College of Agriculture and Life Sciences at Texas A&M University, Texas A&M AgriLife Research and the Texas A&M AgriLife Extension Service.
Weather changes affect vegetation
The new map, shown as “A New Perspective on Texas Phenology” on the institute’s website, shows the annual phenology or pattern of green-up and die-back of vegetation in Texas. This includes the recurring life cycle stages of leafing, flowering and fruiting plants as well as the maturation of crops.
“In a state as large as Texas, there are often dramatic shifts in the weather throughout the year — from extremely cold winters to exceedingly hot summers,” said Garrett Powers, geospatial analyst with the NRI, Bryan-College Station. “Along with these changes in temperature comes changes in the plants around us. These vary from gray, leafless trees in January to vibrant bluebonnets in the spring and struggling St. Augustine grass in August.”
Powers said while these changes are typically observed from ground-level, he wondered what a year of vegetative growth throughout the state would look like from space.
“From an agricultural standpoint, these data can be used to monitor the progression of crops throughout a growing season to detect plant stress or identify irrigation needs,” he said. “These data can be applied in a way to help land stewards determine what management practices may be needed – in the case of severe drought, for example, at larger scales,” he said.
In other words, a regional assessment can be determined in vegetative response related to longer-term climate patterns. He said real-world, remotely collected data provided through Earth observation satellite imagery would provide the data he needed.
Using satellite imagery
The National Aeronautics and Space Administration, NASA, operates satellites capable of photographing the entire surface of the Earth every one or two days. These images are commonly used to assess and monitor vegetation over very large areas, a task that would be extremely difficult using on-the-ground sampling techniques.
Powers said he chose specific “snapshot” satellite images each month and cobbled them together in a map to provide a quick but comprehensive animated view of vegetative changes throughout the state from January through December 2019. The entire year of vegetative variability is shown on a month-by-month basis in under 10 seconds.
“You can see the yearly green-up starts around March in East Texas and pulses outward, eventually reaching the oak and juniper forests of the Davis Mountains by June or July,” he said. “Evidence of irrigated cropland can be seen in the Panhandle region, which remains green year-round, while surrounding native vegetation dies back in the winter months with dropping temperatures. And forage production in the Brazos River valley has its own unique signature with empty fields in winter that green up in April and May, when the first cutting of hay usually occurs.”
Other applications for satellite imagery
Powers said while his map is primarily for illustrative purposes, NRI has put satellite-imaging techniques to work in several projects focused on natural resource conservation.

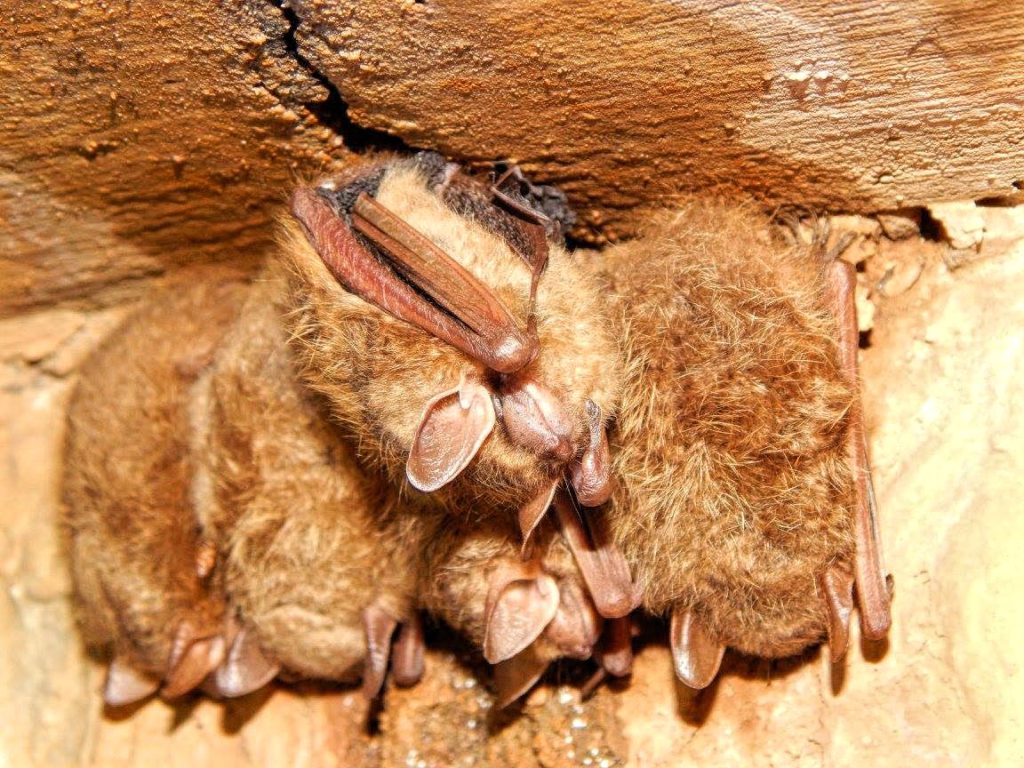
“We have used satellite imagery to help model the presence and abundance of tri-colored bats in culverts across the state of Texas,” he said. “For this, we took the satellite data along with other measurements such as culvert temperature, size and elevation to see what factors influence the roosting habits of bats.”
He said satellite imagery also was used to track vegetation disturbance and recovery in the Florida Keys after Hurricane Irma.
“We used satellite imagery at different time periods to track the health of vegetation in order to determine how much endangered species habitat had been affected and how that habitat was recovering,” he said.
Powers said satellite imagery is a powerful tool for collecting the sort of “big data” needed to see and understand many of the changes that affect the flora and fauna of Texas and beyond.


